Data Storytelling has become an integral aspect of modern business. Using powerful visualisations, in-depth analysis and creative data display, businesses can make use of this invaluable resource to simplify even intricate information whilst still remaining engaging. By harnessing the potency of Data Storytelling companies have the potential for gaining perceptive insights into their processes and making calculated decisions that will steer them towards success – a crucial factor in today’s competitive marketplace! What impact could your company achieve by identifying trends using these techniques?
Understanding the Concept of Data Storytelling
Data Storytelling is an up-and-coming concept that’s being employed to turn raw data into stories that grab attention. It fuses the potency of narrative with analyses of data, forming a captivating story which contains and communicates significant insights. Rather than using traditional reporting techniques or presentations, you can make use of the principles behind storytelling in order to present your data more effectively and purposefully.
In recent years Data Storytelling has become extremely well liked, as businesses are determined to get sense out of their overwhelming amounts of information – how do they interpret it all?
It’s really important to get a handle on using data effectively, in order to construct powerful stories which are both meaningful and memorable. You need an emotional connection if you want your message to stay with people – there’s no point making it if nobody remembers it! Data Storytelling isn’t just about producing graphics or infographics; rather, knowing how best the story within the data can be told. It involves thinking what kind of tale will work for your audience (or even create one!) then figuring out ways that visuals like charts, tables etc…can portray this scene spectacularly.
Do you have data that needs to be presented in a clear story so its key insights can be understood? Data Storytelling is an essential skill for this. It’s all about taking complex information and presenting it in the most impactful way possible, helping your audience make meaningful decisions with ease! This means finding patterns in the data which help uncover major points of interest while also developing effective methods to communicate these effectively. What’s more, depending on where or how you’re sharing your stories – online or offline – there are different considerations needed when doing so. These might include user interface design principles and technical limitations; making sure no matter what platform it appears on, each element works together seamlessly without any added complexities hindering the message behind them!
Bridging Gap between Insightful Analysis & Business Intelligence
Data Storytelling is a must-have for organisations in bridging the gap between insightful analysis and business intelligence. It enables businesses to comprehend how they can exploit data for gaining an edge over their competitors. Data storytelling gives firms a chance to merge data with understanding and stories, which then can be capitalised upon for optimising decision making processes. Through this method, companies are able to make wiser decisions by getting hold of and applying existing information more smartly.
What makes data storytelling so significant is that it permits enterprises to put together a story around their available facts
This story gives us the context of using data, so that it’ll be easy to comprehend for those involved in an organisation. By supplying this backstory, decision makers are more likely to recognise exactly how advantageous their data is when attempting to make informed conclusions about their strategies or operations. To put it another way, having some insight into why and how you’re collecting your information will aid you in making wise choices regarding what steps need taking next.
What’s more, Data Storytelling makes complex datasets easier to comprehend by translating them into visuals like graphs, charts or maps. This assists stakeholders in visually spotting patterns and trends within large collections of data without needing any technical know-how about analytics tools or methods such as cluster analysis or time series forecasting. It can help us gain insights into our information quickly and precisely!
It makes things easier for non-tech folks in an organisation like managers or CEOs who may not have specific technical knowledge but still need access to the data produced by these techniques, being able to get a full grasp of company’s performance and progress against goals set out at the beginning of each financial year/quarterly cycle/monthly cycle etcetera. Data Storytelling helps people within organisations make decisions based on facts rather than intuition derived from years worth of experience alone; this aids communication between departments & teams when trying to align with business objectives & strategy regardless whether individuals possess appropriate expertise for particular task or not. Additionally, it lets organisations pinpoint areas that could be improved quickly using existing resources; ensuing efficiency in their operations while curbing costs, saving time and improving quality all together.
Role of Visualization Tools in Data Presentation
Data storytelling is a really effective way to present business data. It combines visuals, text and essential facts in order to create an impressive story that gets the point across without difficulty. However, for it be successful you need good visualization tools too. Visualization tools help make sense of the figures by providing quick understanding – so you don’t have to trawl through all those numbers and statistics!
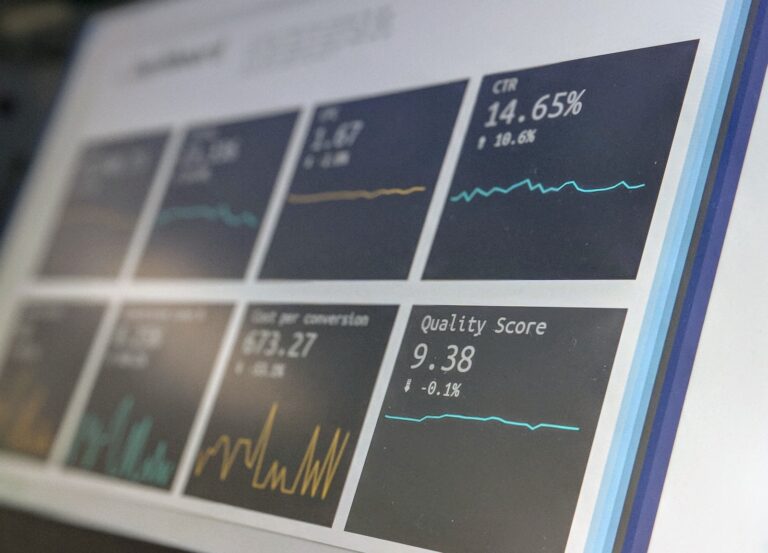
Visualisations have become an ever-growing trend over the past few years, with software such as Tableau, Power BI and Sisense making it simpler than ever for businesses to create attractive visualisations from their data sets. These tools allow users to swiftly transform raw data into charts, diagrams or maps that can be utilized in order to illustrate correlations between different components within a dataset or attain understanding of trends throughout time. For example you could employ a line graph showing how sales fluctuated over time ,or perhaps utilize a bubble chart comparing sales performance amongst various regions or markets .
On top of this these programs also let users tailor made visualisation according to singular preferences – altering colour palettes and adding annotations where need be – allowing them more control when presenting results . This enables companies not only show off important information but also make sure its presented interestingly enough they won’t lose any viewers’ attention during talks/webinars etc..
Harnessing Business Intelligence through Data Storytelling
Data Storytelling is becoming a go-to tool for organisations seeking to make sense of their data. It involves the use of stories and visuals that help communicate meaningful insights from statistical information more effectively than simply relying on data alone. Combining storytelling techniques with powerful analytics, it makes complex concepts easier to comprehend by making them relatable in real life scenarios. What’s great about this approach is that instead of overwhelming people with numbers or technical jargon, you can use stories to turn dry facts into something engaging – sparking curiosity and encouraging further exploration amongst your audience?
Data storytelling enables businesses to tell their story from a more informed point of view by joining up multiple data sources into one cohesive narrative that can be grasped and applied by stakeholders across the board. By using various visualizations such as charts, graphs, maps etc., it brings out tendencies and patterns which would otherwise remain cloaked in huge sets of figures. This not only supplies understanding but also adds context to the inspection making it simpler for people to understand and take direct insights from them.
What’s more, with interactive visuals like heatmaps or lively graphs coupled with drill-down options; data storytelling permits users to analyse given datasets further allowing them uncover deeper knowledge which might have been missed when just looking at regular numbers alone. This gives individuals opportunity gain an even clearer comprehension about how their business operates which they may then use for strategic planning purposes or even gaining competitive advantage initiatives
Effective Utilisation of Data Storytelling for Decision Making
Data Storytelling is the procedure of concocting a narrative around data to viably convey complex information. It’s not just about displaying figures; it’s tied in with making sense of them, understanding their significance and reason, and conveying the story behind them. Data storytelling has become significantly increasingly significant in today’s business world as chiefs need to make fast decisions dependent on extensive measures of data. To be fruitful at quickly and precisely settling on choices, successful usage of data storytelling procedures can help managers acquire knowledge from crude datasets and settle on more educated decisions.
Seeing the data visually can help managers spot patterns or trends that might otherwise have gone unnoticed. This means they may be able to find new possibilities, either for progress or potential problems lurking beneath the surface. Moreover, visuals are a great way of comparing different datasets quickly and effectively; it’s much easier to see how your company measures up against others in its sector this way!
Moreover, data storytelling can not only help decision makers spot potential opportunities but also understand the impact of certain changes on their operations. Through visualisations like cause-and-effect relationships between sale growth rate and customer service experience etc., taking into account these connections makes it possible to anticipate risks more accurately as well as plan ahead for any unforeseen events that may occur due to lacking insight from raw datasets. By using a variety of available visualisation tools at our disposal nowadays, companies have been able to increase operational efficiency while ensuring better decisions are taken with access to deeper business insights which could eventually lead them towards improved profitability in the long term.
To wrap it up, Data Storytelling has demonstrated to be an exceedingly useful tool for companies in order to gain better understanding of their operations and bring forth effective plans that lead them towards success. Utilizing the correct visualisation software along with strong data analysis capabilities as well as presentation techniques can vastly help organisations identify trends or prospects which would otherwise stay concealed. By gaining advantages from data storytelling businesses are able to make calculated decisions resulting into increased profits and satisfied customers – something we all strive for!
Fancy upping your game when it comes to data storytelling? Our unique course in story-telling through data is just the ticket! Master how to communicate key findings in an arresting and enthralling way that will have your crowd mesmerised. We cover all aspects, from devising impactful narratives, designing visualisations and using the latest technology in reporting on facts & figures. Take advantage of this once-in-a lifetime chance today; enrol here so you can start learning how to create a smashing tale with numbers! With our extensive programme, shifting from beginner status right up pro level might take no time at all if you’re keen enough – don’t let go of this opportunity – join us now for mastering telling stories about information like never before!